Chapter S6 – Wemming Chung’s Plant
MyOMLab Operations Management
Heizer, Render and Munson
13th Edition
Calculate upper and lower control limits for mean and range charts.
Calculator Preview
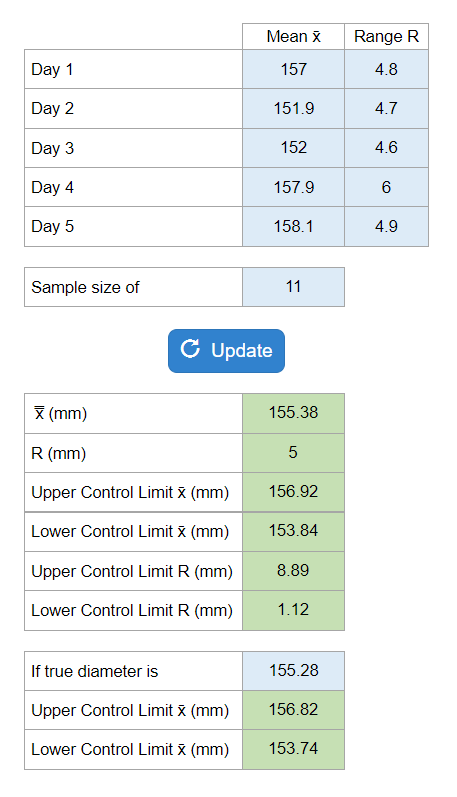
Your numbers will vary.
Calculate upper and lower control limits for mean and range charts.
Your numbers will vary.
What is percentage defective of an average lot of goods which were inspected through acceptance sampling method?
What is percentage defective of an average lot of goods which were inspected through acceptance sampling method?
Determine a type of control chart could be used when could have more than one mistake per item sampled?
Determine a type of control chart could be used when could have more than one mistake per item sampled?
What is another name for cause-and-effect diagrams?
What is another name for cause-and-effect diagrams?
Which is NOT one if the costs of quality?
Which is NOT one if the costs of quality?
Which is NOT a technique used to create employee empowerment?