Normal Probability Plot Given: Asks if Normal.
Essentials of Statistics for Business & Economics WebAssign
Anderson, Sweeney, Williams, Camm, and Cochran
09th Edition
They give you a graph with dots along a straight line and ask if it’s normal.
They give you a graph with dots along a straight line and ask if it’s normal.
State the null hypothesis, alternative hypothesis, identify the type of test to be carried out.
Your numbers will vary.
Determine if a normal distribution can be used for the p̂ distribution, state hypotheses, compute p̂ and test statistic, find the P-value, determine if reject or fail to reject, and explain.
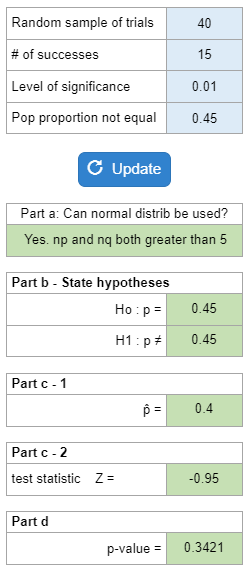
Your numbers will vary.
Find the probability that the sample proportion will be less than or greater than a given proportion.
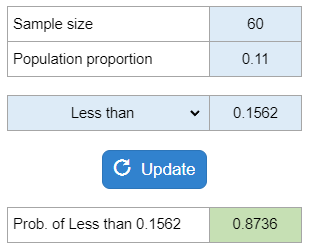
Your numbers will vary.
Find the probability that the sample proportion will be greater or less than the given probability.
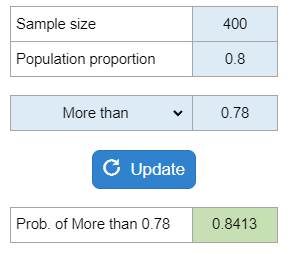
Your numbers will vary.
Develop a 90%, 95% and 99% confidence interval. Determine what happens to the margin of error and interval as the confidence level increased.
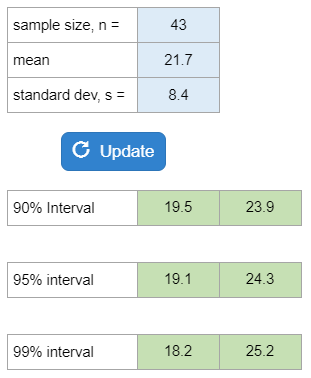
Your numbers will vary.
Determine the level of significance, null and alternate hypothesis, sampling distribution to use, if the sample size is sufficiently large, test statistics, p-value, and sketch. Reject or fail to reject the hypothesis, and interpret.
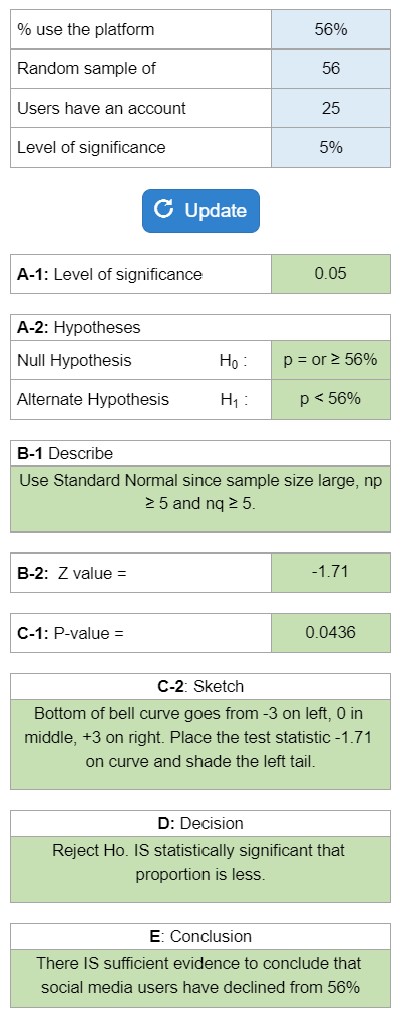
Your numbers will vary.
Given the proportion of games won and the sample of games, they ask you to determine the sample size, the population proportion, the expected number of successes, the expected number of failures, and determine whether the statement is true or false.
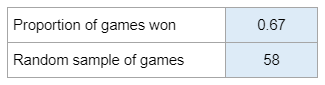
Your numbers will vary.
Find mean (in minutes) of the sampling distribution of mean commute time, standard deviation of sampling distribution, and describe the shape of the sampling distribution.
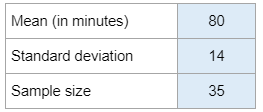
Your numbers will vary.
Determine the probability that a certain number of cats or dogs is selected without replacement.
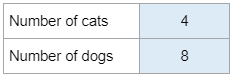
Your numbers will vary.