6.1.25 A Commuter Must Pass Through Traffic Lights
MyStatLab
Pearson
They give you a horizontal list of # of traffic lights and probabilities. They ask you for a mean and standard deviation.
Calculator Preview

Your numbers will vary.
They give you a horizontal list of # of traffic lights and probabilities. They ask you for a mean and standard deviation.
Your numbers will vary.
What % total complaints attributed to most prevalent?
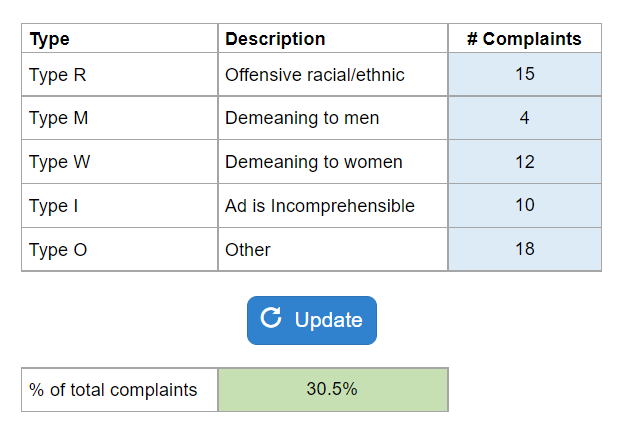
Your numbers will vary.
Use Pareto Chart to determine the greatest proportion of complaints.
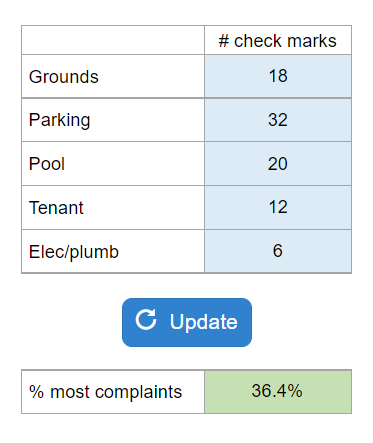
Your numbers will vary.
Calculate Average Outgoing Quality.
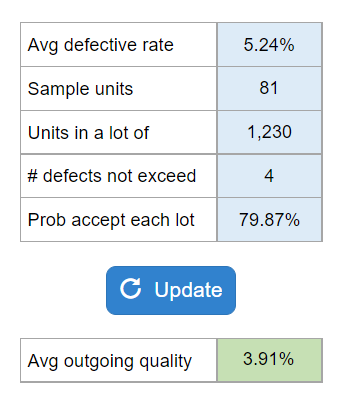
Your numbers will vary.
Find upper and lower control limits.
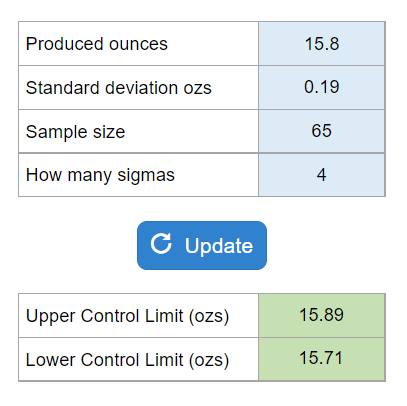
Your numbers will vary.
Find upper and lower specification limits.
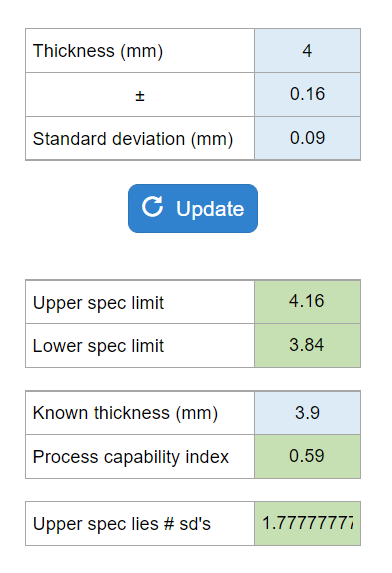
Your numbers will vary.
Find upper and lower control limits.

Your numbers will vary.
Calculate the process capability ratio and determine if capable.
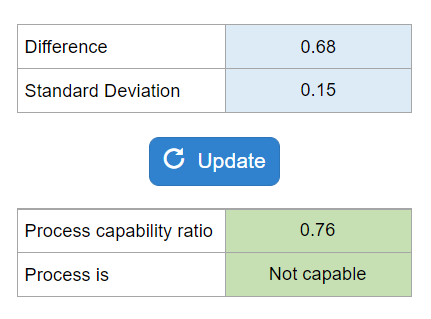
Your numbers will vary.
Calculate upper and lower control limits for mean and range charts.
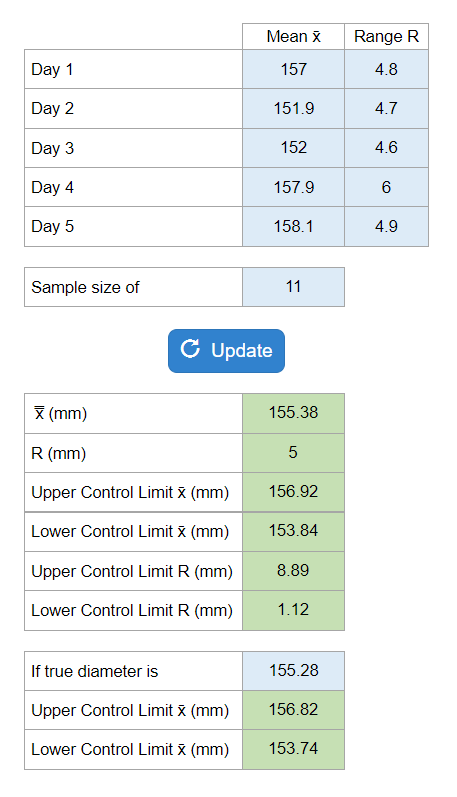
Your numbers will vary.
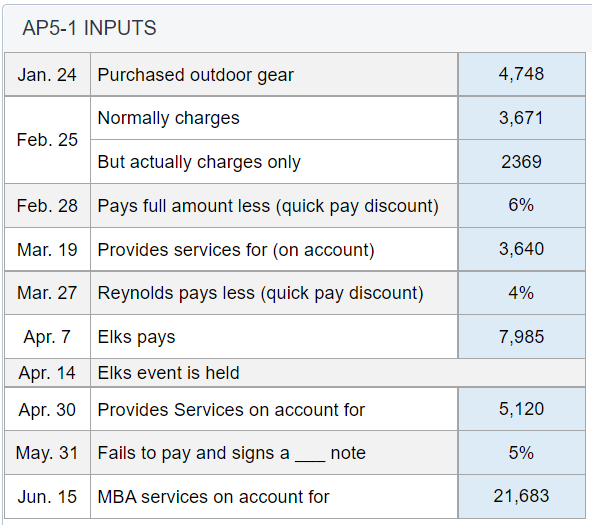
Prepare journal entries, partial balance sheets, evaluate the allowance of uncollectables, create a partial income statement with sales revenues, cost of goods sold, and gross profit. Calculate cost of goods sold and ending inventory using FIFO.
Then, using information about the net realizable value, reestimate the partial income statement and balance sheets. Finally, create a depreciation schedule showing depreciation and book values and record adjusting entries for depreciation and insurance.
Your numbers will vary.