3.1.51 – Box Plots of Weekly Gas Prices
MyStatLab
Pearson
Three box plots of gas prices are given with questions on spread, skewness, outliers, and IQR.
Three box plots of gas prices are given with questions on spread, skewness, outliers, and IQR.
A scatterplot plots is shown with R-squared, intercept, CO2 with questions about meaning of R-squared, equation, meaing of slope, meaning of y-intercept.
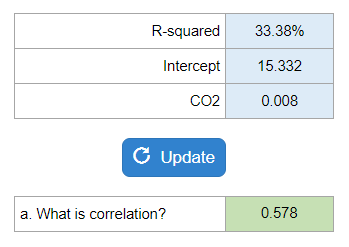
Your numbers will vary.
They give you a horizontal list of # of traffic lights and probabilities. They ask you for a mean and standard deviation.

Your numbers will vary.
They give weights and scores for two suppliers and ask which supplier should be chosen and what is the score for that vendor.

Your numbers will vary.
Given changes in account balances as either debits or credits, including assets, common stock, liabilities, and paid-in capital, determine net income for the year.
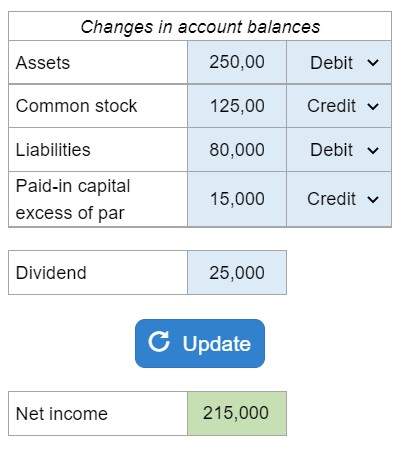
Your numbers will vary.
Asks you to find the accumulated investment by the end of year 3 for Options 1, 2, and 3.

Your numbers will vary.
This calculator will solve the arc elasticity using the midpoint method.
Match the given transactions to its financial statement.
Given the bonds acquired, the percentage on the bond, interest rate, and paid investment… find the journal entries.
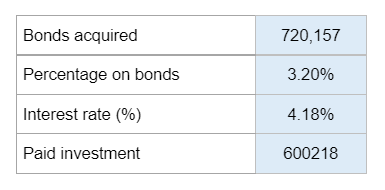
Your numbers will vary.
Given information about account balances… prepare a trial balance.
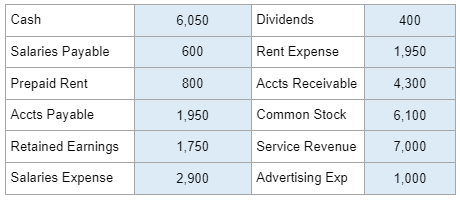
Your numbers will vary.