3.1.51 – Box Plots of Weekly Gas Prices
MyStatLab
Pearson
Three box plots of gas prices are given with questions on spread, skewness, outliers, and IQR.
Three box plots of gas prices are given with questions on spread, skewness, outliers, and IQR.
A scatterplot plots is shown with R-squared, intercept, CO2 with questions about meaning of R-squared, equation, meaing of slope, meaning of y-intercept.
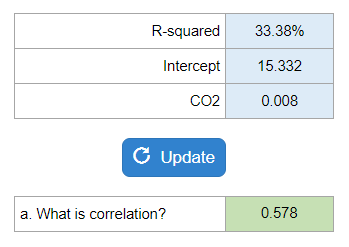
Your numbers will vary.
They give you a horizontal list of # of traffic lights and probabilities. They ask you for a mean and standard deviation.

Your numbers will vary.
They give weights and scores for two suppliers and ask which supplier should be chosen and what is the score for that vendor.

Your numbers will vary.
Given changes in account balances as either debits or credits, including assets, common stock, liabilities, and paid-in capital, determine net income for the year.
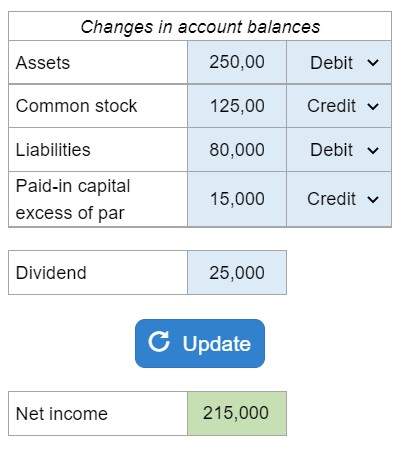
Your numbers will vary.
data on purchase price, contribution margin, repurchase frequency, and defection rate and they ask you for the VLC and the percent change if the rate is changed.
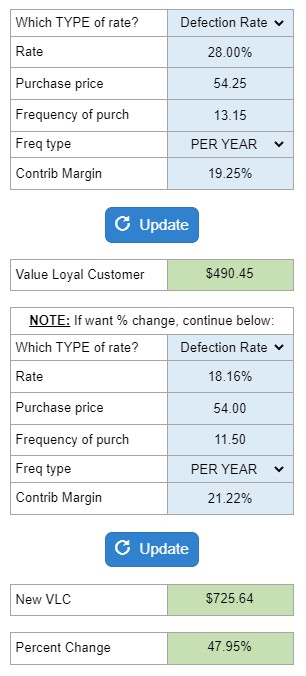
Your numbers will vary.
This is a GENERIC Value of a Loyal Customer (VLC) solver: it works for ANY VLC-type problem! It gives the Value of a Loyal Customer and also gives the percent change (if needed).
Your numbers will vary.
Given the current age, age wanted to retire, and average % of stock market growth in the past 80 years, find how much you will have after investing X amount of money.

Your numbers will vary.
Given the cost from each of two stores, the discount rate, find the present values and which store should purchase from.
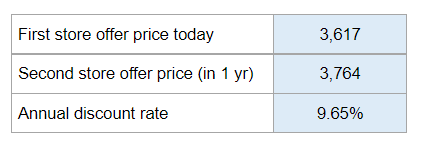
Your numbers will vary.
Describes how to calculate inventory turnover and weeks of supply.