Chapter 6 – Avant-garde Clothing
MyOMLab Operations Management
Heizer, Render and Munson
13th Edition
What % total complaints attributed to most prevalent?
Calculator Preview
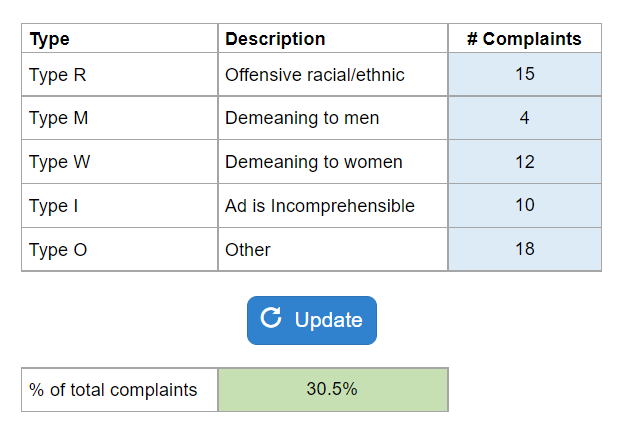
Your numbers will vary.
What % total complaints attributed to most prevalent?
Your numbers will vary.
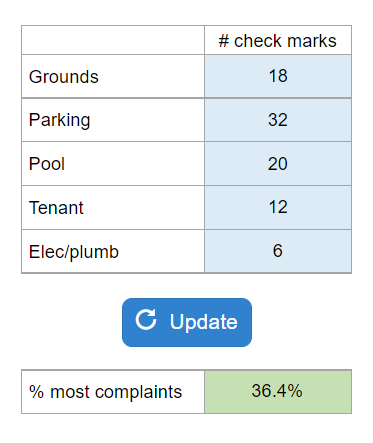
Use Pareto Chart to determine the greatest proportion of complaints.
Your numbers will vary.
Calculate Average Outgoing Quality.
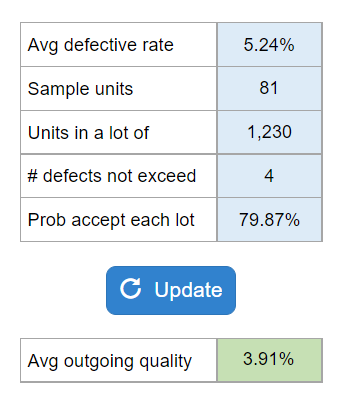
Your numbers will vary.
Find upper and lower control limits.
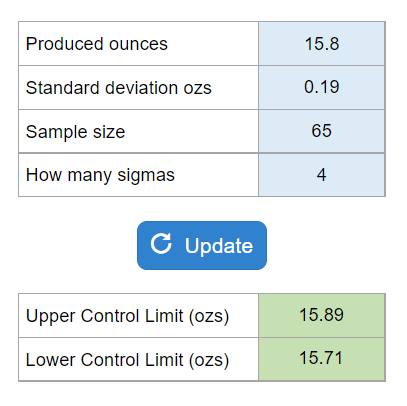
Your numbers will vary.
Find upper and lower specification limits.
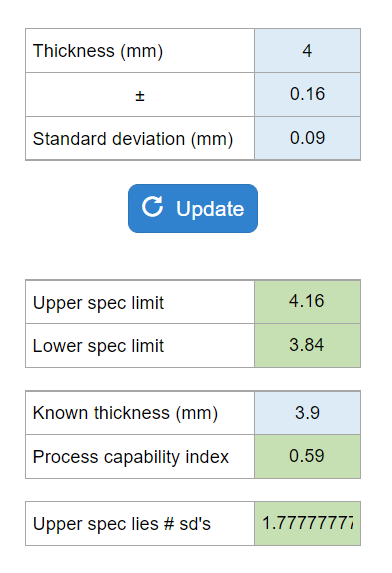
Your numbers will vary.
Find upper and lower control limits.

Your numbers will vary.
Calculate the process capability ratio and determine if capable.
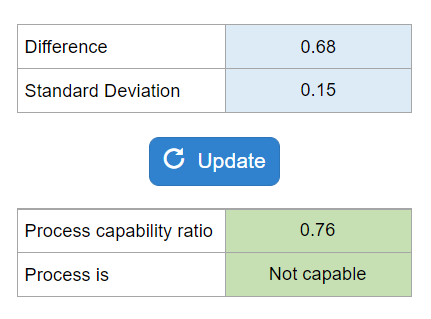
Your numbers will vary.
Calculate upper and lower control limits for mean and range charts.
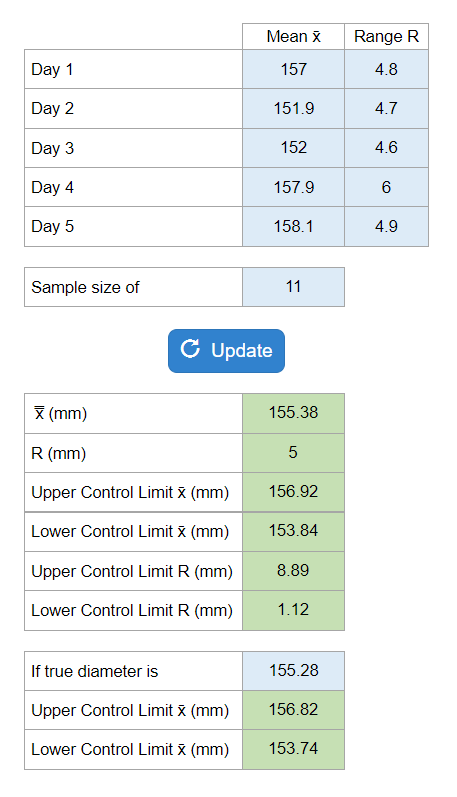
Your numbers will vary.
Determine the upper and lower control limits for the c-chart measuring incidents of nonconformities in IRS telephone inquiries, and assess the level of variation based on the c-chart.
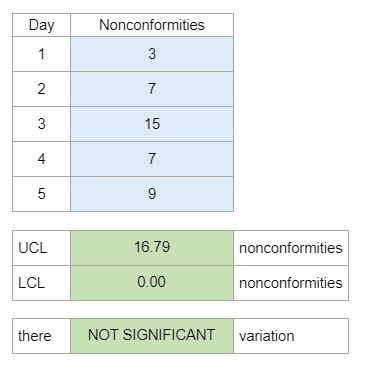
Your numbers will vary.
Determine control chart, control limits, assess process control for monitoring defectives, and analyze the impact of changing the sample size on control limits and conclusions.
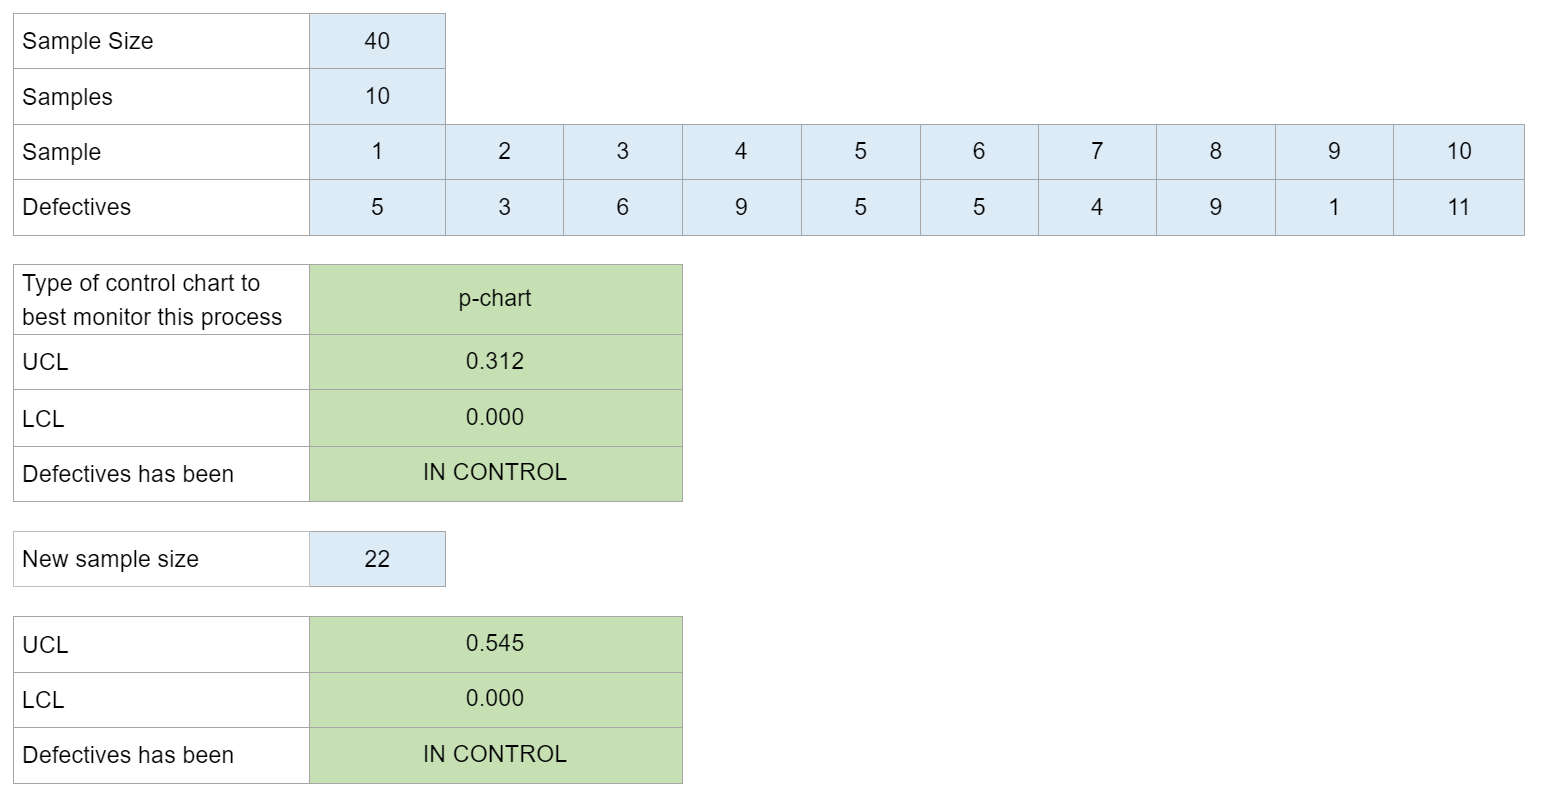
Your numbers will vary.