9.1.53 – Insurance Co Checks Police Records
MyStatLab
Pearson
Tells of so many accidents, how many teens were behind the wheel and asks for the confidence interval, and interpret it.
Calculator Preview
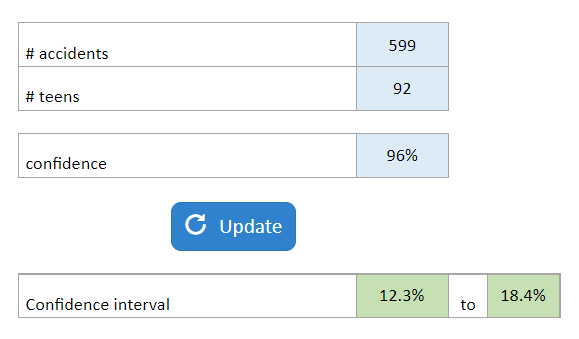
Your numbers will vary.
Tells of so many accidents, how many teens were behind the wheel and asks for the confidence interval, and interpret it.
Your numbers will vary.
They give you the results of a poll on downloading music and ask for the confidence interval.
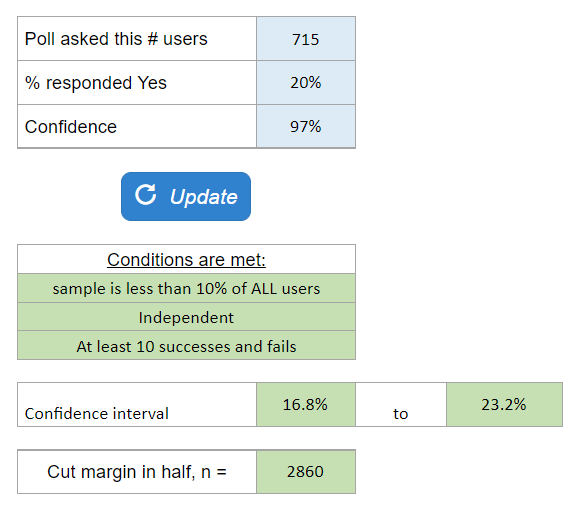
Your numbers will vary.
Gives info on two different countries and asks for the two proportions and a confidence interval and if the countries are different.
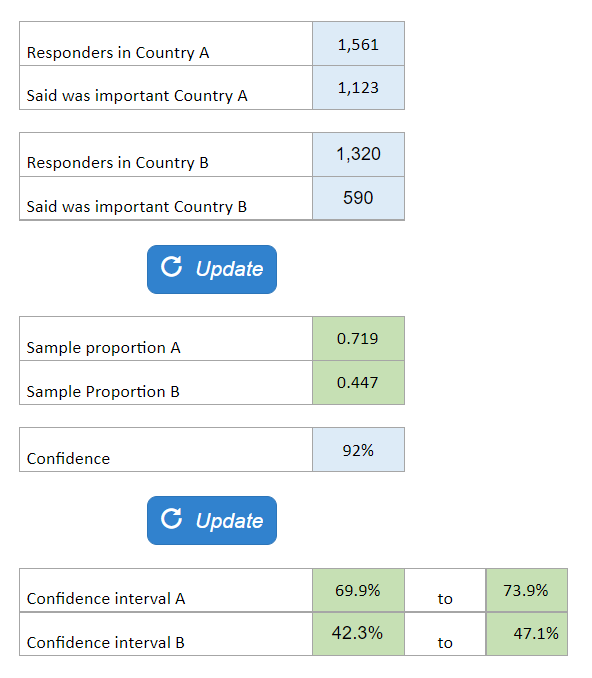
Your numbers will vary.
They give a sample of internet users and asked about making one copy of the CD. They give the % that responded yes, they would still buy. They ask for the confidence interval.
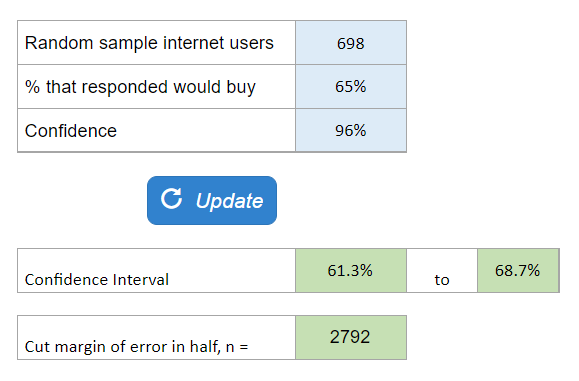
Your numbers will vary.
They give the margin of error and confidence and ask how many vehicles should be sampled.
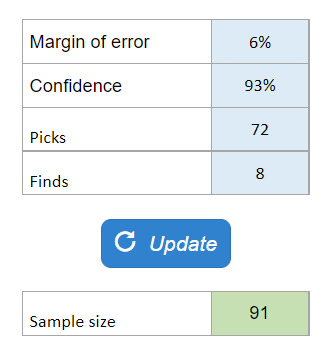
Your numbers will vary.
They give you some polling data and ask you what the confidence level is.
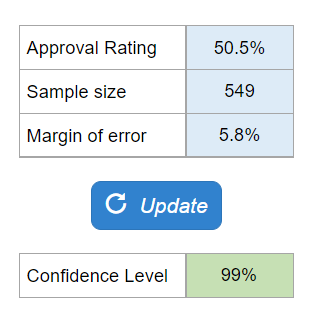
Your numbers will vary.
They tell you the % of adults over 50 who have never graduated from high school and ask how many should be surveyed with various margin of errors.
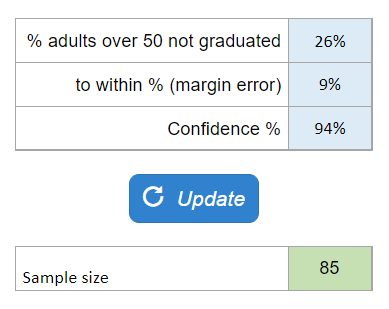
Your numbers will vary.
You’re given a test hypothesis and a P-value. Then you’re asked to find and interpret the decision using the significance provided. If the decision from (a) is an error, what kind? Lastly, they give you a new significance level and ask about your decision and if it’s an error, and what type.
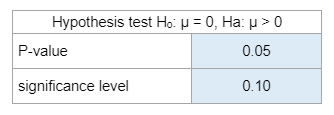
Your numbers will vary.
You’re given a histogram and summary statistics for flights leaving on time each month from 2001-2006 and told there is no evidence of a trend. Then you’re asked if the independence assumptions are met, if the randomization condition is met or is it suitably representative, if the 10% condition is met, and if the nearly normal condition is met. Next, you’re given a confidence level and have to find and interpret the interval.
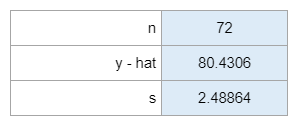
Your numbers will vary.
Given the area average, the standard deviation, and the number of healthy adults – find the shape, mean, and standard deviation of the sample distribution.

Your numbers will vary.