CH 4 Quiz – MAPE
MyOMLab Operations Management
Heizer, Render and Munson
13th Edition
Given the demand and forecast for each period… find the MAPE
Calculator Preview
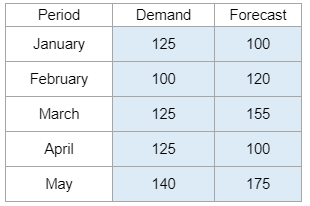
Your numbers will vary.
Given the demand and forecast for each period… find the MAPE
Your numbers will vary.
Given the amount of roses sold each year and weights… using the weighted moving average model, find the forecast for year seven.

Your numbers will vary.
Given alpha, and the demand and forecast for each period… find the forecast for the month.
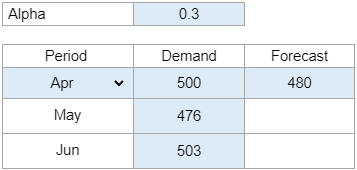
Your numbers will vary.
Gives you the sample size, the mean of the sample means, and the average range. Asks for the lower control limit and the upper control limit.
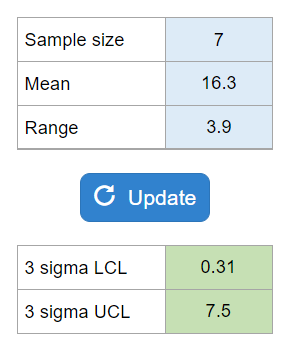
Your numbers will vary.
You are given the X double bar, standard deviation, and N. Asks for the 3 sigma control limits for an x-bar control limit.
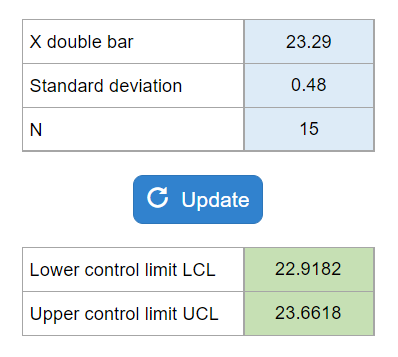
Your numbers will vary.
You are given two specification limits, the mean, and the standard deviation. Asks for the CPK and the capability.
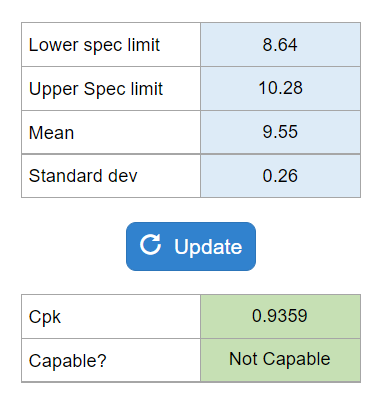
Your numbers will vary.
Gives you the total defects, the number of samples, and the sample size. Asks for the standard deviation. Also provided are mean, LCL, and UCL if needed.
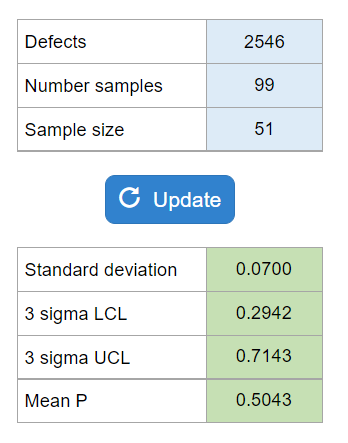
Your numbers will vary.
They give you a list of 8 flaws and ask for the lower and upper control limits for a c-chart.
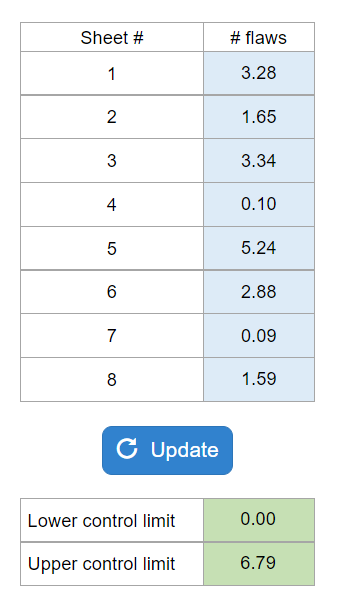
Your numbers will vary.
Given the number of inspectors, test per hour, and the amount that each inspector can inspect in the hour… find the utilization.
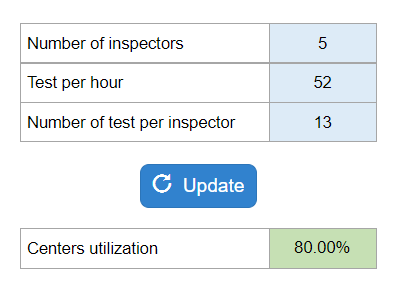
Your numbers will vary.
Find the crossover point and possibly which option should be selected based on given demand.
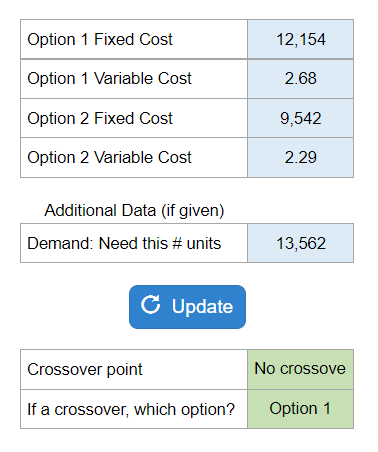
Your numbers will vary.