Problem 2.1.37 – A Survey of the Entering MBA Students
MyStatLab
Pearson
Percent of MBA from Region, Two-years and evening from region, marginal distribution, conditional distribution, independent.
Calculator Preview
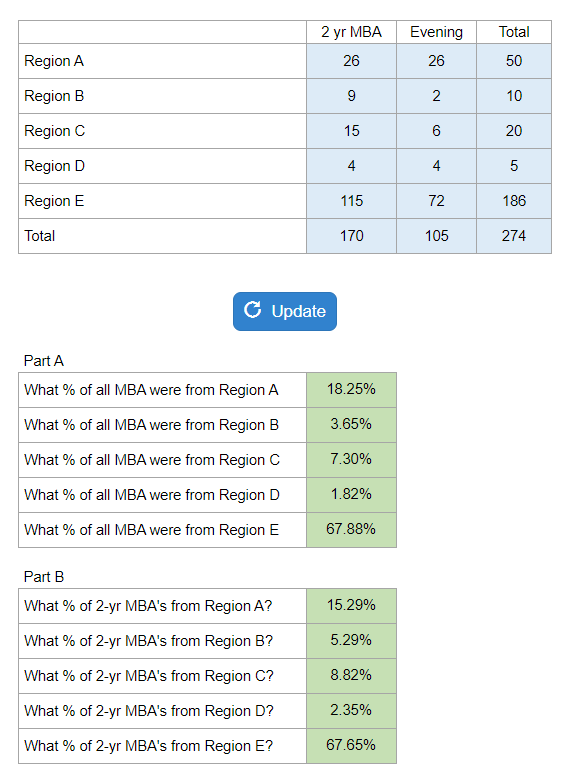
Your numbers will vary.
Percent of MBA from Region, Two-years and evening from region, marginal distribution, conditional distribution, independent.
Your numbers will vary.
What % admitted, higher or lower for females, compare, program admission rates.
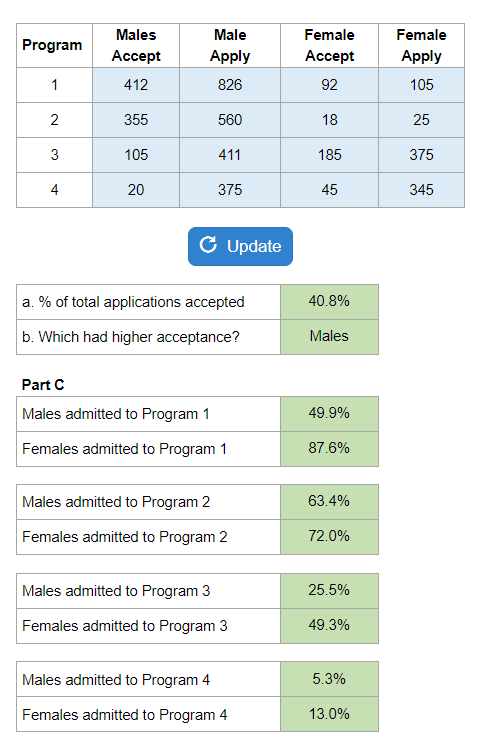
Your numbers will vary.
From raw data and a provided histogram, calculate the minimum, maximum, median, Q1, Q3, mean, IQR, range.
Your numbers will vary.
A long list of data numbers is given and student is asked to make a stem-leaf plot, box plot, answer questions.
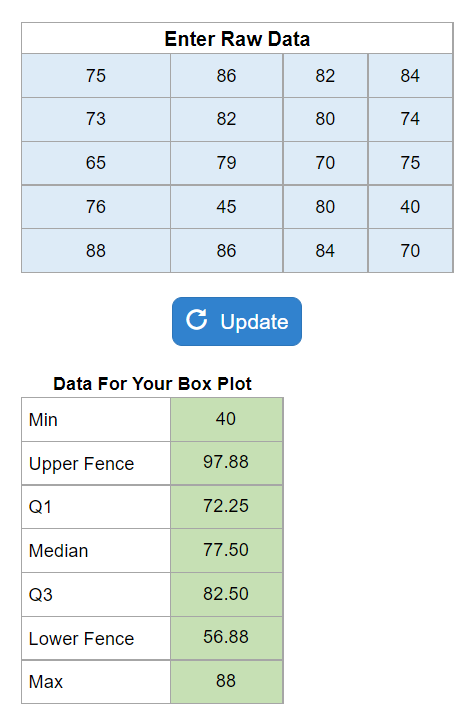
Your numbers will vary.
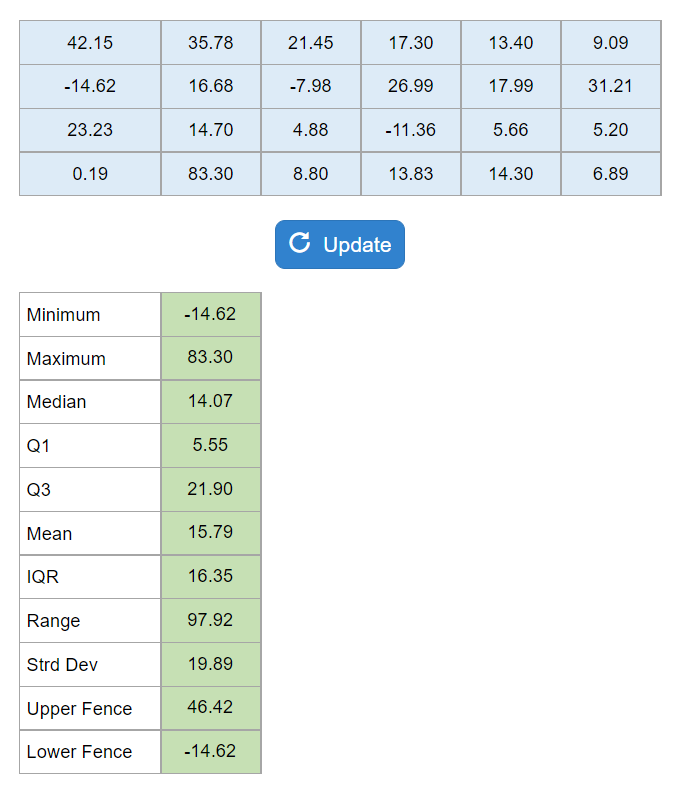
From a long list of numbers calculate the minimum, maximum, median, Q1, Q3, Range, IQR.
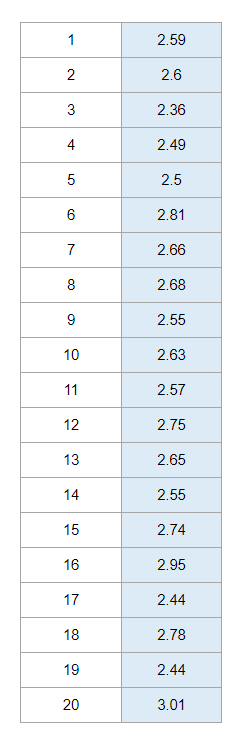
Your numbers will vary.
Find Z-scores for both price and square footage and decide which is more unusual.
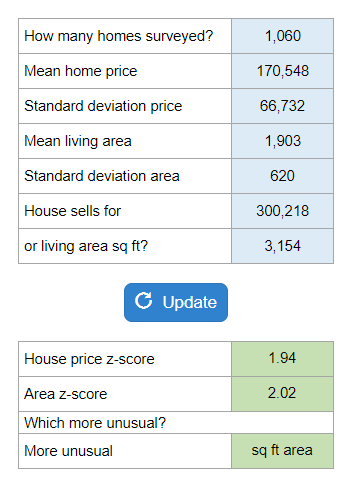
Your numbers will vary.
Summary statistics are given and asked to interpret the data as skewed, symmetric, etc.
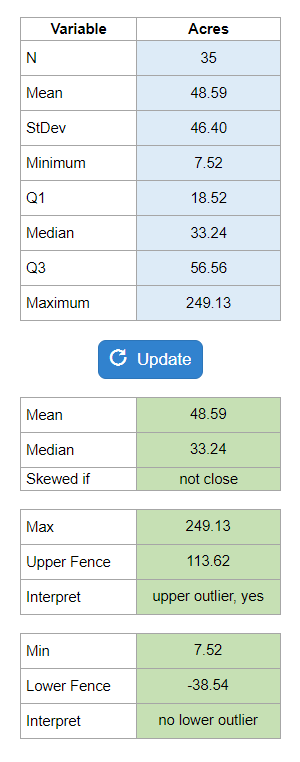
Your numbers will vary.
An equation is given to predict sales based on price. Questions follow including explanatory variable, response variable, slope, y-intercept, making a prediction, residual.
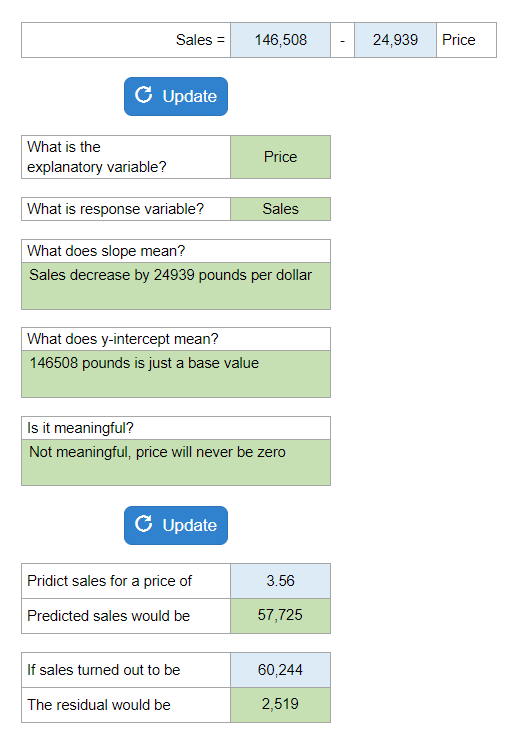
Your numbers will vary.
No scatterplot is given. R-squared, intercept, slope, and s are given and a series of questions is asked including the equation of the regression line, the meaning of intercept and slope, a prediction, more or less than predicted, and residual.
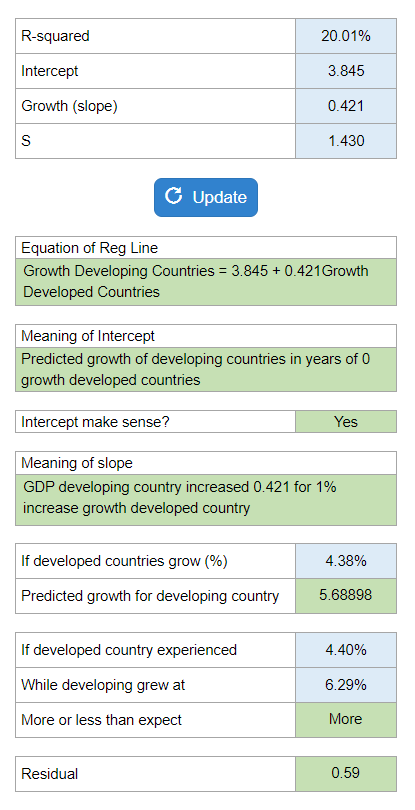
Your numbers will vary.
An equation is given with Flow vs Return and a series of questions asked such as, interpret the intercept and slope, the predicted fund flow, and the residual.
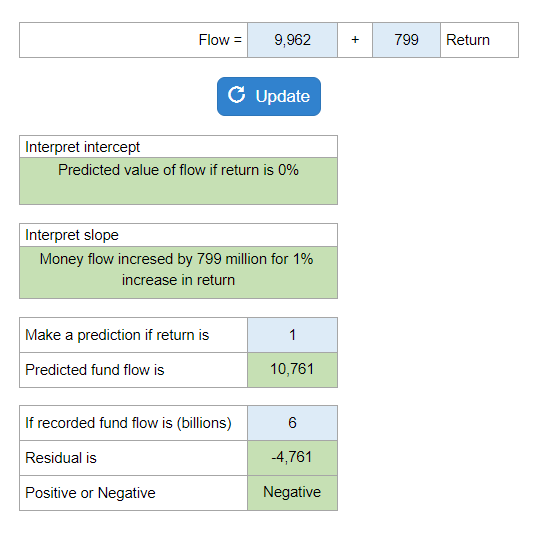
Your numbers will vary.