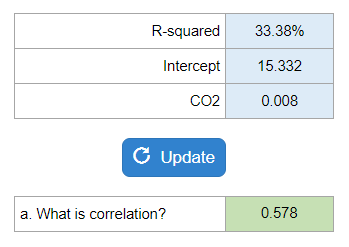
4.1.67 – The Following Scatterplot shows the Mean Annual Carbon Dioxide
MyStatLab
Pearson
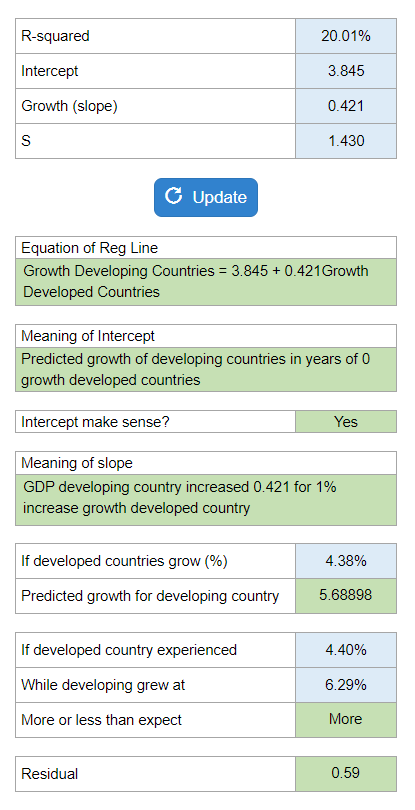
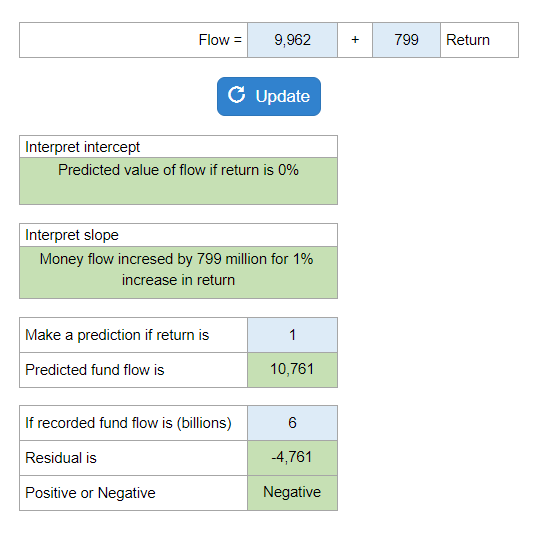
A scatterplot plots is shown with R-squared, intercept, CO2 with questions about meaning of R-squared, equation, meaing of slope, meaning of y-intercept.
Calculator Preview
Your numbers will vary.