Problem 6.18 – Yield Curves

0
(0)

Calculator Preview

Your numbers will vary.

Difficulty – Medium

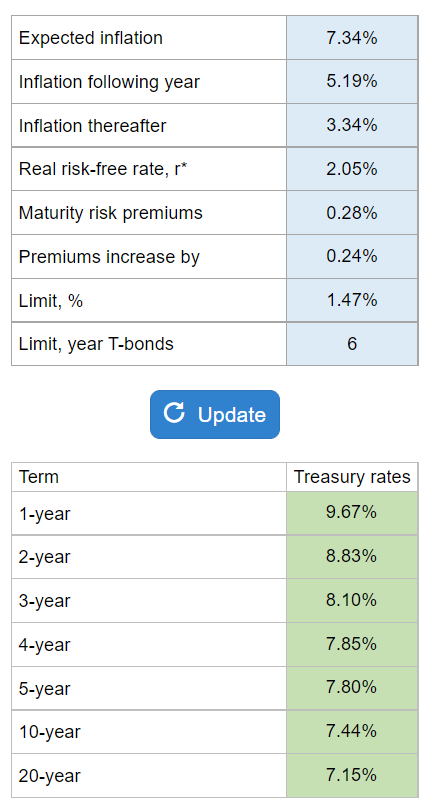
Given the inflation rates, real risk-free rate, maturity risk premiums, premium increase, and the limit: a.) Calculate the interest rate on 1-year, 2-year, 3-year, 4-year, 5-year, 10-year, and 20-year Treasury securities b.) Estimate and plot what you believe a AAA-rated company’s yield curve. c.) On the same graph, plot the approximate yield curve of a much riskier lower-rated company.

Experts Have Solved This Problem

Please login or register to access this content.

  • Search Terms: % (hint: (those (which , -, -year .% a aaa-rated about and approximate as assume at be believe bond bonds bonds. bonds.) c. calculate can company company’s curve curve. curve. b. curves days) default defaulting each estimate expected few firm following for from furthermore, graph graph, had have) higher highest in increase inflation interest is its like limit long-term longerterm look lower-rated mature maturities maturity maturity, much next of on or plot premium premiums r rate rate, rating real remain rise risk risk-free riskier same securities securities. short-term suppose t-bonds. a. that the thereafter. think to treasury up versus very what will with would year year, yield you zero
  • The use of this software is to provide check figures to compare against your own individual work. Accuracy of the check figures is not guaranteed. By purchasing credits and using our software/services, you assume all liability for the use of the software and affirm that you are abiding by your university’s academic policies. Please report any errors above.