Problem 6.01 – U.S. Treasury Securities

0
(0)

Calculator Preview

Your numbers will vary.

Difficulty – Normal

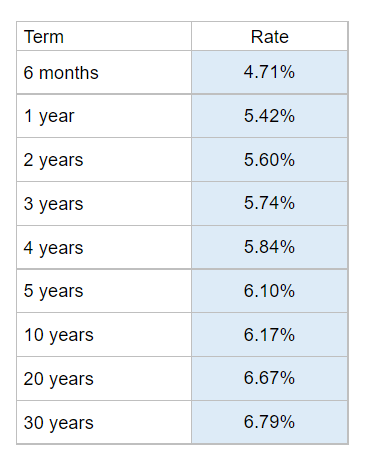
Given a table of U.S. Treasury security rates and are asked to interpret the yield curve and explain what the graph means.

Experts Have Solved This Problem

Please login or register to access this content.

  • Put YOUR unique numbers into the blue boxes.
  • Answers will appear in green.

  • Search Terms: . . . a. .% .% a a. and as assume b. based borrow c. curve curve, curves d. data. data. b. does explain. follows: follows: term for graph if image information is it loan long longer make money months needed of on or plot rate rate renew securities sense short shown? shown? c. tell term term? term? explain. transcribed text: than that the these this to treasury type u.s. were what would year year, years yield yields you you? you? d.
  • The use of this software is to provide check figures to compare against your own individual work. Accuracy of the check figures is not guaranteed. By purchasing credits and using our software/services, you assume all liability for the use of the software and affirm that you are abiding by your university’s academic policies. Please report any errors above.